[This post has been moved to: http://blog.spatialbits.de/post/assigning-what3words-addresses-to-OSM-building/]
What3Words offers multilingual and memorizable addresses for 3x3 meter grid cells on the entire globe (more on this in an earlier post). So with w3w it becomes possible to assign addresses e.g. to buildings even in countries without functioning traditional addressing schemes.
As a demo I assigned addresses to buildings in Sierra Leone, as available in the OpenStreetMap database (open in new window):
For this example I downloaded the OSM data from Geofabrik, loaded the buildings (> 420.000) into a postgreSQL database and derived the centroid for each polygon. The centroids' lat/lon coordinates are used to query the what3words API in order to receive the w3w in different languages.
(Alternatively of course it would be possible to receive the center points of the buildings on the fly e.g. from the overpass API).
Follow @spatialbits
Dienstag, 16. Dezember 2014
Sonntag, 2. November 2014
What3Words geocoder for geopy
[This post has been moved to: http://blog.spatialbits.de/post/what3words-geocoder-for-geopy/]
What3Words is an innovative, plain simple and multilingual addressing scheme:
Languages currently supported by the service are: DE, EN, ES, FR, PT, RU, SV, TR.
[Edit: 2014-12-10]
My pull request has been accepted and the what3words geocoder became part of geopy 1.5.0!
Follow @spatialbits
What3Words is an innovative, plain simple and multilingual addressing scheme:
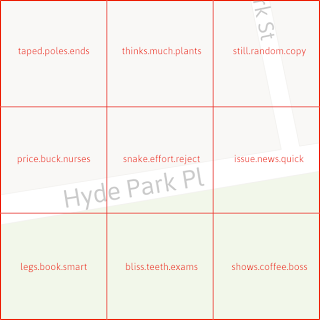
"w3w is a giant grid of the world made up of 57 trillion squares of 3 metres x 3 metres. Each square has been given a 3 word address comprised of 3 words from the dictionary. An example of a w3w address is gazed.across.like"

(source: What3Words)
I recently added a What3Words geocoder to the geopy package.
So now its possible to geocode and reverse geocode What3Words from python, as shown in this example:Languages currently supported by the service are: DE, EN, ES, FR, PT, RU, SV, TR.
[Edit: 2014-12-10]
My pull request has been accepted and the what3words geocoder became part of geopy 1.5.0!
Follow @spatialbits
Montag, 22. September 2014
Geocoding with python and OSM
[This post has been moved to: http://blog.spatialbits.de/post/geocoding-with-python-and-OSM/]
Geocoding is the process of relating implicit location information (such as an address or a the name of a river) to explicit location information in form of geographic coordinates.
Several companies, e.g. Google and Nokia/HERE offer commercial geocoding services/APIs. Nominatim is a tool to search OSM data by name and address and to generate synthetic addresses of OSM points and hence a geocoder operating on the OSM database.
While many geocoders offer easy to use APIs that can be directly utilized from a web browser, they unfold their full potential when called from e.g. a script enabling batch geocoding for many place names at once.
geopy is a geocoding toolbox for Python, offering access to numerous geocoding services.
Here is an example of geocoding with Nominatim:
which returns several dicts like:
Among other details these contain lat/lon coordinates and the boudning box of the feature. But wouldn't it be nice if the result would contain the full geometry as well? Well, while this is supported by the Nominatim API it was not - until recently - by the geopy toolbox. I added support for exactly that, so now:
leads to:
so the full geometries are returned.
EDIT (2014-09-23):
(Note: Currently this is implemented in my github-fork, it should appear in the official repo eventually. A pull request is pending.)
The pull request has been accepted and so the functionality is now available in the official repo (release 1.3.0).
EDIT (2014-10-18):
Please make sure to respect Nominatim's usage policy!
Follow @spatialbits
Geocoding is the process of relating implicit location information (such as an address or a the name of a river) to explicit location information in form of geographic coordinates.
Several companies, e.g. Google and Nokia/HERE offer commercial geocoding services/APIs. Nominatim is a tool to search OSM data by name and address and to generate synthetic addresses of OSM points and hence a geocoder operating on the OSM database.
While many geocoders offer easy to use APIs that can be directly utilized from a web browser, they unfold their full potential when called from e.g. a script enabling batch geocoding for many place names at once.
geopy is a geocoding toolbox for Python, offering access to numerous geocoding services.
Here is an example of geocoding with Nominatim:
which returns several dicts like:
{u'display_name': u'Elbe, Landkreis Wittenberg, Sachsen-Anhalt,
Deutschland, European Union', u'importance': 0.72552692721096,
u'place_id': u'9208507982', u'lon': u'12.5663365', u'lat': u'51.867922',
 u'osm_type': u'relation', u'licence': u'Data \xa9 OpenStreetMap
contributors, ODbL 1.0. http://www.openstreetmap.org/copyright',
u'osm_id': u'123822', u'boundingbox': [u'50.0168724060059',
u'54.0075302124023', u'8.22170829772949', u'15.9315462112427'], u'type':
 u'river', u'class': u'waterway'}
Among other details these contain lat/lon coordinates and the boudning box of the feature. But wouldn't it be nice if the result would contain the full geometry as well? Well, while this is supported by the Nominatim API it was not - until recently - by the geopy toolbox. I added support for exactly that, so now:
leads to:
MULTILINESTRING((15.53613 50.7756972,15.5364593 50.7755378,15.5367906 50.7754773,15.5372784 50.7754914,15.5378943 50.7752649,15.5382691 50.7752837,15.5384418 50.7752514,15.5388037 [...]))

LINESTRING(7.0094126 51.1325696,7.0093372 51.1324799,7.009245 51.1323739,7.0091836 51.1322698,7.0090853 51.1321503,7.0090361 51.1320982,7.0089716 51.1319945 7.0085078 51.1314622 [...])
so the full geometries are returned.
EDIT (2014-09-23):
The pull request has been accepted and so the functionality is now available in the official repo (release 1.3.0).
EDIT (2014-10-18):
Please make sure to respect Nominatim's usage policy!
Follow @spatialbits
Samstag, 6. September 2014
Visualizing OSM data with cartodb to aid HOTOSM validation
[This post has been moved to: http://blog.spatialbits.de/post/vizualizing-osm-data-w-cartodb/]
Playing around with cartodb has been on my list for a while now. Also I started to contribute to HOTOSM lately. During mapping and validation work for the Ebola related HOTOSM tasks I noticed that in some areas the relevant features are not mapped as expected. Presumably unexperienced mappers map e.g. buildings as single nodes and/or don't apply the highway tag guidelines for Africa correctly. As some enthusiastic mappers may work on sparse areas in a short time its difficult track down mistakes and notify the contributor early.
While josm offers flexible filter functionalities I find it hard to get a flexible overview of a wider area.
Hence I wanted to find out how if and how the visualization features of cartodb could be useful here.
So I signed up for a free test account at cartodb (50 MB and 5 table included) and downloaded the OSM data for Sierra Leone from Geofabrik.
While it is possible with cartodb to import OSM data directly and extract relevant data using SQL (postgis) queries, I imported the data into a locale database and ran some queries to create three tables (csv) containing the following features:
Uploading the csv to cartodb and creating visualizations is easy then, resulting in the following map:
The first layer ('single nodes buildings') shows some clusters where buildings are mapped as single nodes, e.g. just south of 'Bo', an area that was mapped as part of the HOTOSM task #605.
The second layer ('building != yes') shows all centroids of buildings and the color indicates the tag. Some clusters, e.g. where buildings are tagged as 'house' become obvious.
The third layer then shows the starting nodes of highways and their related tags though the color, showing e.g. a lot of 'footways'.
Cartodb is easy to use and leads to quick visualization results, revealing areas with (potential) mapping/quality issues to further evaluate.
I just set this up as an experiment. As the OSM map evolves the pictures will change and hence my map will out date. However cartodb offers synchronization with data sources. So it would be rather easy to implement a workflow that creates e.g. a daily picture of a given area and a focus on specific validation issues.
Follow @spatialbits
Playing around with cartodb has been on my list for a while now. Also I started to contribute to HOTOSM lately. During mapping and validation work for the Ebola related HOTOSM tasks I noticed that in some areas the relevant features are not mapped as expected. Presumably unexperienced mappers map e.g. buildings as single nodes and/or don't apply the highway tag guidelines for Africa correctly. As some enthusiastic mappers may work on sparse areas in a short time its difficult track down mistakes and notify the contributor early.
While josm offers flexible filter functionalities I find it hard to get a flexible overview of a wider area.
Hence I wanted to find out how if and how the visualization features of cartodb could be useful here.
So I signed up for a free test account at cartodb (50 MB and 5 table included) and downloaded the OSM data for Sierra Leone from Geofabrik.
While it is possible with cartodb to import OSM data directly and extract relevant data using SQL (postgis) queries, I imported the data into a locale database and ran some queries to create three tables (csv) containing the following features:
- all single nodes that are tagged as buildings
- all buildings that that are not tagged with 'yes' (centroid points of the polygons)
- all start points of highways that are not tagged according to the guidelines
Uploading the csv to cartodb and creating visualizations is easy then, resulting in the following map:
(Point data copyright by OpenStreetMap contributors under the ODbL)
The first layer ('single nodes buildings') shows some clusters where buildings are mapped as single nodes, e.g. just south of 'Bo', an area that was mapped as part of the HOTOSM task #605.
The second layer ('building != yes') shows all centroids of buildings and the color indicates the tag. Some clusters, e.g. where buildings are tagged as 'house' become obvious.
The third layer then shows the starting nodes of highways and their related tags though the color, showing e.g. a lot of 'footways'.
Cartodb is easy to use and leads to quick visualization results, revealing areas with (potential) mapping/quality issues to further evaluate.
I just set this up as an experiment. As the OSM map evolves the pictures will change and hence my map will out date. However cartodb offers synchronization with data sources. So it would be rather easy to implement a workflow that creates e.g. a daily picture of a given area and a focus on specific validation issues.
Follow @spatialbits
Dienstag, 17. Juni 2014
Text Mining INSPIRE Conference Contributions
So the INSPIRE Conference 2014 (#inspire_eu2014) starts tomorrow - after two days of intensive workshops.
For me this poses the challenge to decide which of the parallel sessions I should attend to. As I have been experimenting with the R framework lately I decided to make use of some text mining techniques instead of reading through all the abstracts to get an idea about hot topics, trends and potentially interesting sessions.
Here are some of my 'results'. More on the methodology below.
To get a first impression I take a look at terms that appear frequently (15+) in the contribution's titles:


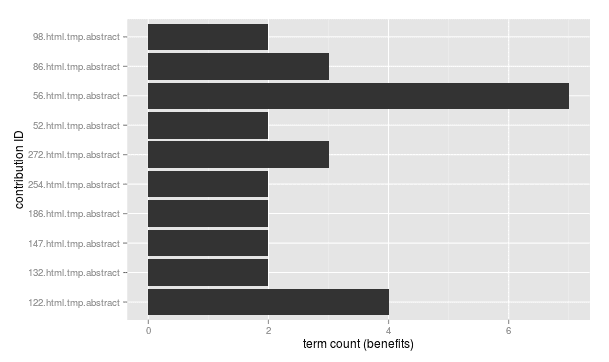


http://inspire.ec.europa.eu/events/conferences/inspire_2014/schedule/submissions/<ID>.html
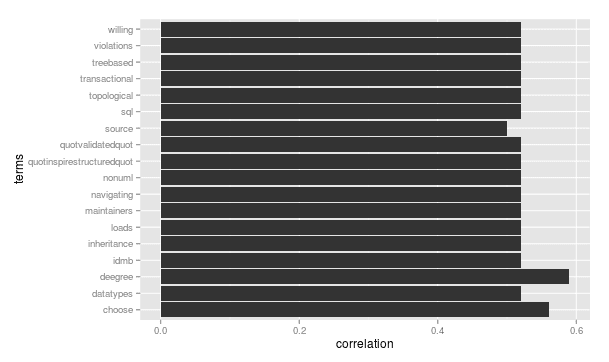
Besides that the tm-package offers a lot of functionality to analyse the datasets further. For example I can identify terms that are correlated to a specific term. For instance terms that are correlated (0.5+) with "wfs" (considering all abstracs) are:
So a few words on what I did.
Getting ready:
- download the abstracts (wget)
- removing headlines, html, blank lines, line breaks (sed, tr)
- extracting abstracts, titles (sed)
- convert all characters to lower-case
- remove numbers, punctuation, whitespaces
- remove URLs
- remove stopwords
- apply word stemming
- apply stemcompletion
Follow @spatialbits
Abonnieren
Posts (Atom)